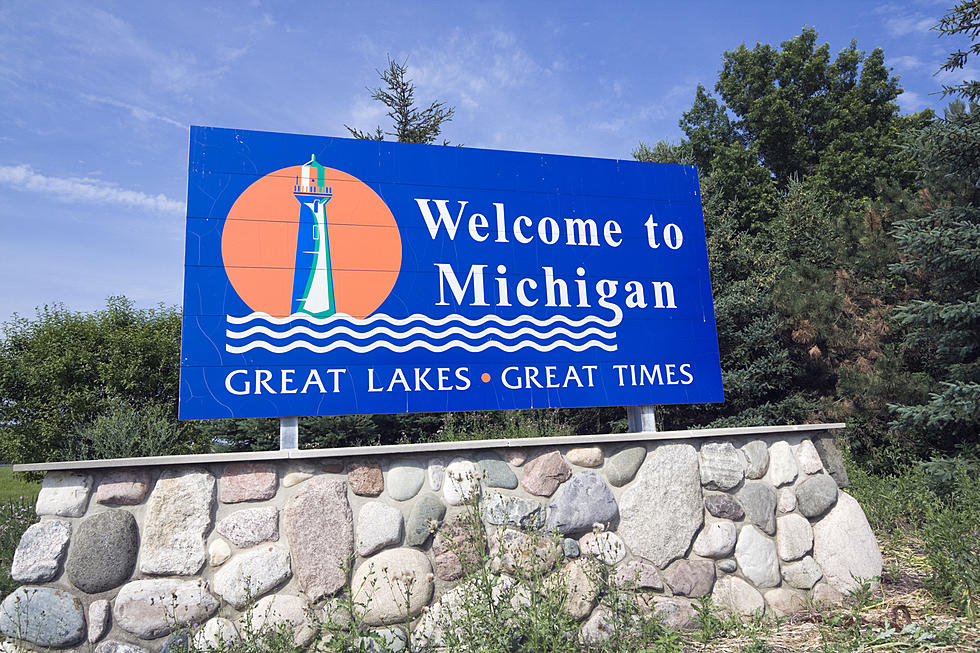
This Is How Much Singles Need To Make To Be Comfortable In Michigan
You don't have to be a math wizard to realize that the price of almost everything has increased while most people's income has trailed far behind.

Just go to the grocery store to buy some food or pay the rent bill and you'll see that your dollar doesn't go as far as it did before.
A new survey has looked into how much a single person needs to make in each state to live comfortably.
How The Study Was Done
The personal finance website GoBankingRates.com looked at data from the U.S. Bureau of Labor Statistics and research by the state of Missouri to determine how much single people, not couples or families, pay in necessities each year. Then, those amounts were doubled to factor in discretionary spending and savings.
What Does The Average Single Person In Michigan Make?
According to Talent.com, The average salary in Michigan is $39,842 per year or $19.16 per hour.
Entry-level positions start at $30,194 per year while most experienced workers make up to $89,224 per year.
This Is How Much Singles Needs To Make To Be Comfortable In Michigan
Out of all 50 states, Michiganders find themselves in the better half of the study but when you take a look at what the results say single people need to make and compare it to what they actually do there is a good-sized gap.
The average amount someone needs to make to live comfortably in Michigan is $50,049. If you look at the numbers for what the average single person in Michigan makes you will see there is a $11,000 dollar difference or about a $5 an-hour difference.
This Is How Much Singles Need To Live Comfortably In Each State
Rank | State | Income Required
- 1 Mississippi $45,906
- 2 Oklahoma $46,024
- 3 Alabama $46,577
- 4 Arkansas $47,111
- 5 Kentucky $47,318
- 6 Kansas $47,379
- 7 West Virginia $47,732
- 8 Missouri $47,771
- 9 Iowa $48,518
- 12 Tennessee $48,774
- 11 Nebraska $49,009
- 10 Georgia $49,051
- 13 Illinois $49,372
- 14 Wyoming $49,666
- 15 Indiana $49,855
- 17 Michigan $50,049
- 16 Louisiana $50,087
- 18 Ohio $50,157
- 19 Texas $50,497
- 20 New Mexico $51,214
- 21 Minnesota $51,668
- 22 South Dakota $52,095
- 23 South Carolina $52,222
- 24 North Dakota $52,807
- 25 Wisconsin $53,122
- 26 North Carolina $53,531
- 27 Pennsylvania $53,838
- 28 Utah $55,293
- 29 Delaware $56,571
- 31 Montana $57,056
- 30 Florida $57,064
- 32 Virginia $57,293
- 34 Nevada $58,580
- 33 Idaho $58,634
- 35 Colorado $59,218
- 36 Rhode Island $59,936
- 37 Arizona $60,026
- 38 Maine $60,862
- 39 New Hampshire $62,935
- 40 Connecticut $63,078
- 41 New Jersey $64,463
- 42 Washington $65,640
- 43 Oregon $65,763
- 44 Vermont $65,923
- 45 Maryland $67,915
- 46 Alaska $71,570
- 47 New York $73,226
- 48 California $80,013
- 49 Massachusetts $87,909
- 50 Hawaii $112,411
You can read more about the study here.
Did Al Capone Use This Spring Lake Home for Bootlegging?
United States 25 Most Dangerous Colleges and Universities Campuses
Inside the $5.9M Cedar-Clad 'Boardwalk Cottage' on Mackinac Island
More From Mix 95.7


